If you operate a solar farm in the UAE or wider GCC, you already know the math: every underperforming module chips away at your return on investment. Dust storms, ambient temperatures exceeding 50°C, and the sheer scale of multi-megawatt arrays make it nearly impossible to catch hotspots, micro-cracks, and string failures through manual walkthroughs alone.
This blog breaks down the specific desert-related challenges that degrade PV output, explains how aerial thermal and visual inspection solves each one, and outlines a practical framework you can apply, whether you manage a 5 MW rooftop portfolio or a 500 MW utility-scale plant.
Desert environments are uniquely hostile to photovoltaic infrastructure. Understanding the failure modes is the first step toward building an effective inspection and maintenance strategy.
Soiling and dust accumulation are the most persistent issues. Fine sand particles settle on module surfaces daily, and seasonal shamal winds deposit thick layers that can reduce energy yield by 15 to 40% if left unaddressed. The challenge is not just that panels get dirty; it is that soiling is uneven. Certain rows, angles, and edge modules accumulate dust faster than others, making blanket cleaning schedules wasteful and targeted cleaning impossible without panel-level data.
Thermal stress and hotspot formation are accelerated in extreme heat. When ambient temperatures regularly exceed 45°C, even minor cell defects (a hairline crack, a weak solder joint, a bypass diode failure) escalate into hotspots that can permanently damage modules. A hotspot invisible from ground level at 40°C can reach 100°C internally, degrading encapsulant material and eventually causing a fire risk.
Sand abrasion and micro-cracking occur over time as wind-driven particles erode anti-reflective coatings and create surface micro-cracks. These cracks expand with thermal cycling, meaning the daily swing from cool mornings to peak afternoon heat, and compound into cell-level failures that conventional visual inspections simply cannot detect.
String-level electrical faults, including PID (Potential Induced Degradation), are common in high-humidity coastal areas like Abu Dhabi and Doha. These faults reduce string output silently, often going unnoticed for months until cumulative generation losses become significant.
Aerial inspection using calibrated infrared sensors and high-resolution RGB cameras addresses each of these challenges at a speed and resolution that ground-based methods cannot match.
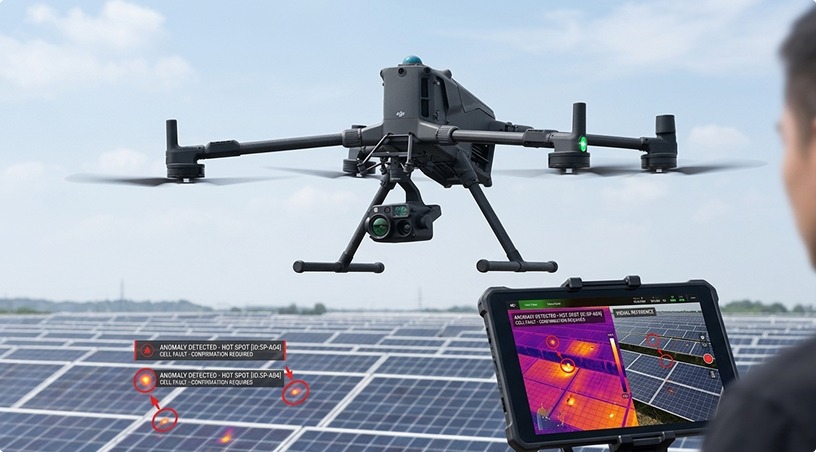
A drone equipped with a radiometric thermal camera flies automated grid patterns over an array, capturing module-level thermal data across the entire plant. The resulting thermal map reveals temperature differentials: healthy modules operate within a narrow thermal band, while faults such as cell defects, bypass diode failures, or string-level electrical issues manifest as thermal anomalies relative to neighboring modules.
This is not just about finding one bad panel. The real operational value lies in classification and prioritization. Not every thermal anomaly demands immediate attention. A well-structured inspection workflow categorizes defects by severity: critical hotspots that risk fire or module destruction, moderate anomalies that warrant scheduled replacement, and minor deviations that should be monitored over time. This severity-based classification ties directly to your maintenance planning and warranty documentation.
For soiling assessment, the combination of thermal and visual data tells you exactly which zones need cleaning and which do not. Rather than dispatching cleaning crews across an entire 200-hectare site, you can target the rows and blocks where soiling has measurably impacted thermal performance, reducing cleaning costs while recovering the generation output that matters most.
A repeatable, data-driven inspection process typically follows five stages:
Stage 1: Mission Planning and Site Assessment
Before a drone takes off, the inspection team reviews the plant layout, inverter string maps, and historical generation data to identify areas of known underperformance. Flight paths are programmed for automated grid coverage with sufficient overlap for accurate orthomosaic stitching. In UAE conditions, flights are scheduled during peak irradiance hours, typically between 10:00 AM and 2:00 PM, when thermal contrast between healthy and faulty modules is most pronounced.
Stage 2: Automated Data Capture
Industrial-grade UAV platforms fly pre-programmed missions across the array, capturing calibrated radiometric thermal imagery and high-resolution visual data simultaneously. A multi-megawatt installation that would take a ground crew days or weeks to walk can be imaged in a matter of hours. The key here is consistency: automated flight paths ensure every module is captured at the same altitude, angle, and sensor settings, making the data comparable across inspection cycles.
Stage 3: AI-Assisted Analysis and Defect Classification
Raw thermal imagery is processed through analytics software that automatically detects temperature anomalies, classifies defect types (hotspot, string fault, bypass diode failure, soiling pattern), and assigns severity levels. This is where the volume of data, often tens of thousands of images per inspection, becomes manageable. Manual review of every image is neither practical nor necessary when automated classification can flag the 2 to 5% of modules that require attention.
Stage 4: Centralized Reporting and Maintenance Integration
Inspection findings are delivered as geo-referenced defect maps with GPS coordinates, severity classifications, and recommended actions. The best inspection workflows integrate this data into a centralized platform where O&M teams can track defect status, compare current findings against historical baselines, and generate work orders directly. This eliminates the scattered spreadsheets and PDF reports that slow down maintenance response times.
Stage 5: Trend Analysis and Predictive Maintenance
A single inspection provides a snapshot. Repeated inspections over quarterly or semi-annual cycles reveal trends: which module batches are degrading faster, which inverter strings show recurring faults, and whether cleaning schedules are actually restoring expected output. This historical view transforms inspections from reactive troubleshooting into predictive asset management.
The economics are straightforward. Traditional ground-based thermography for a large solar farm requires technicians with handheld IR cameras walking row by row, a process that is slow, inconsistent, and exposes personnel to extreme heat. For a 100 MW plant, a manual thermal survey can take two to three weeks. An automated drone-based survey covers the same area in two to three days, with higher data quality and full module-level coverage.
Beyond speed, there is the cost of missed defects. A hotspot left undetected for six months does not just reduce output from that module. It can damage adjacent cells, compromise string performance, and in extreme cases void manufacturer warranties. Early detection through regular aerial inspection protects both generation revenue and asset value.
For O&M teams managing multiple sites across the UAE and GCC, the ability to conduct rapid, standardized inspections across a distributed portfolio, and consolidate findings into a single analytics platform, is a significant operational advantage. It means your maintenance decisions are driven by data, not guesswork.
Inspection and cleaning are two sides of the same coin. Thermal data from drone surveys identifies exactly where soiling is impacting performance, and specialized drone-supported cleaning mechanisms can then target those specific zones. This precision approach avoids the cost of cleaning panels that are still performing within acceptable parameters, while ensuring that heavily soiled areas are addressed before yield loss compounds.
In desert environments where water is scarce and labour-intensive manual cleaning is the norm, this targeted approach can reduce cleaning costs by 20 to 30% while maintaining higher average generation output across the plant.
Maximizing PV performance in UAE desert conditions comes down to a clear framework: understand the specific environmental stressors degrading your panels, inspect at module-level resolution using calibrated thermal and visual sensors, classify defects by severity to drive maintenance priorities, centralize your inspection data for trend tracking and predictive planning, and close the loop with targeted cleaning and corrective action. Each stage builds on the last, turning raw aerial data into measurable improvements in generation output and asset longevity.
Gulfnet delivers this complete workflow, from automated UAV inspection and AI-assisted defect analysis to centralized reporting through Gulfnet Insight® and drone-supported panel cleaning, across solar installations throughout the UAE and GCC. Whether you are commissioning a new plant or optimizing an existing portfolio, our certified pilots, industrial-grade platforms, and renewable energy inspection expertise help you move from reactive maintenance to data-driven asset management.
Get in touch with our team for a free consultation.
How often should solar panels be inspected by drone in the UAE?
Most operators in the UAE benefit from quarterly drone inspections, with additional surveys after major dust storms or shamal events. Quarterly cycles provide enough data points to track seasonal degradation patterns and catch emerging faults before they compound into significant generation losses or warranty issues.
What types of defects can drone thermal inspection detect on solar panels?
Drone-mounted radiometric thermal cameras detect hotspots caused by cell cracks, failed bypass diodes, string-level faults, PID degradation, and junction box failures. Combined with high-resolution visual imagery, inspections also identify physical damage such as surface micro-cracking, delamination, snail trails, and uneven soiling across the array.
Can drone inspections be performed on operational solar farms without shutdown?
Yes. Drone inspections are entirely non-intrusive and require no electrical isolation or plant shutdown. Flights are conducted during peak irradiance when the array is generating at full load, which actually produces the best thermal contrast for accurate defect detection and classification.
How does drone inspection data integrate with solar farm maintenance systems?
Inspection deliverables include geo-referenced defect maps with GPS coordinates and severity classifications. These reports can be integrated into centralized asset management platforms, enabling O&M teams to generate work orders directly, track defect resolution over time, and compare findings across multiple inspection cycles.
What is the cost advantage of drone solar inspection over manual methods in the GCC?
Drone inspections typically cost 40 to 70% less than equivalent ground-based manual surveys while delivering higher data quality and full module-level coverage. A plant that takes weeks to inspect manually can be surveyed in days, reducing labour costs, minimizing heat exposure for field teams, and accelerating the time from data capture to maintenance action.


 Go back